Features
Live Market Data
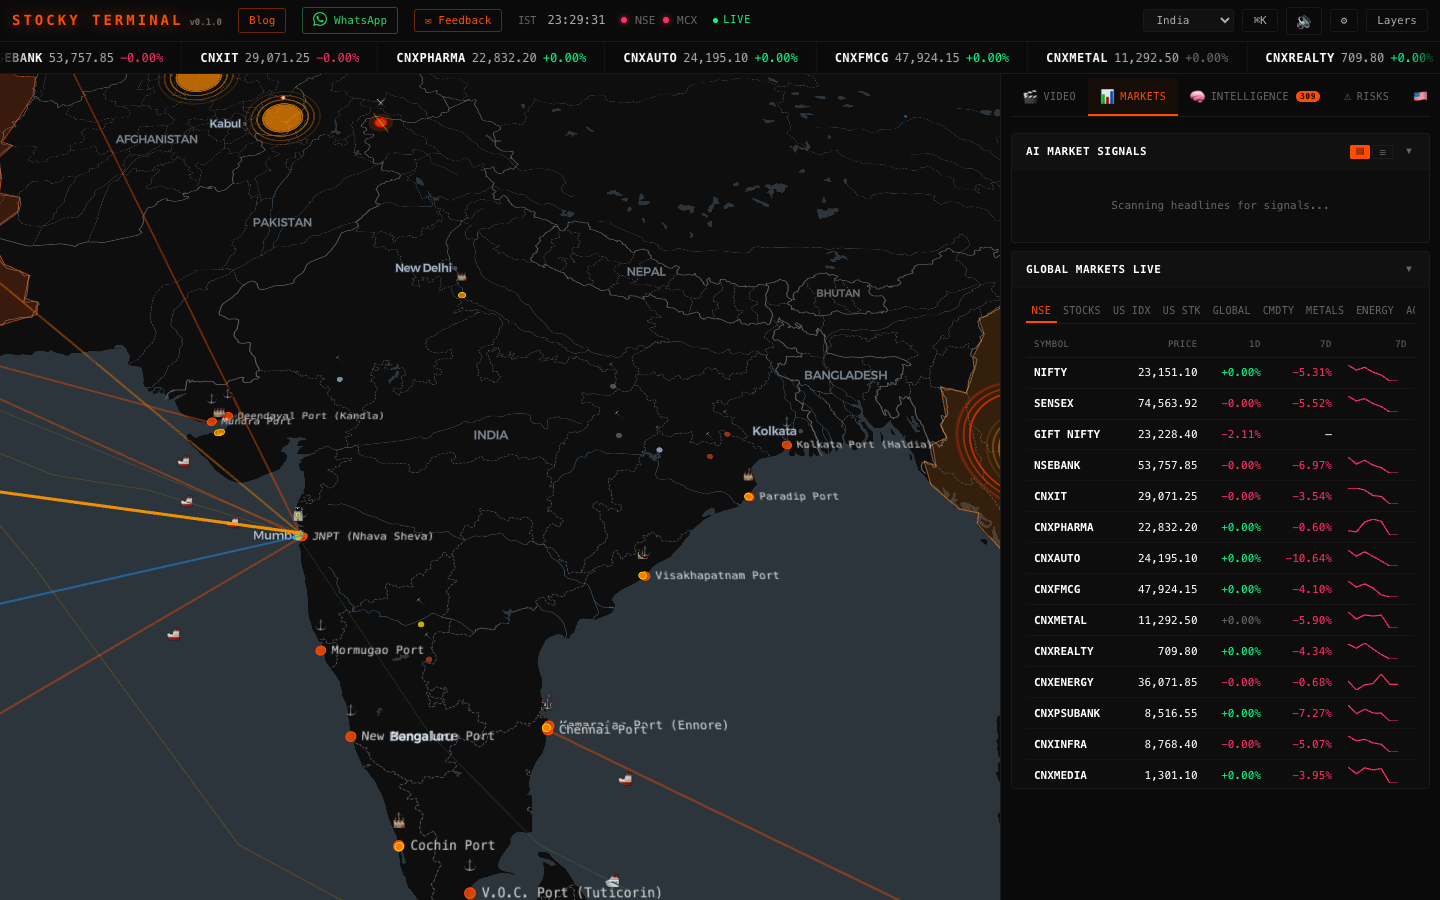
Stocky Terminal streams real-time market data from multiple exchanges and data providers. The Markets panel displays live prices, daily change percentages, and 7-day trends for a comprehensive set of instruments:
- NSE Indices — Nifty 50, Bank Nifty, Nifty IT, Nifty Pharma, Nifty Auto, Nifty Financial Services, Nifty Metal, Nifty Energy, Nifty FMCG, Nifty Realty, and 16 more sector indices covering the full breadth of Indian equity markets.
- BSE Indices — Sensex and key BSE sectoral indices for cross-exchange comparison.
- Global Indices — S&P 500, Nasdaq, Dow Jones, FTSE 100, DAX, Nikkei 225, Hang Seng, Shanghai Composite, and more. Track 1D and 7D percentage changes at a glance.
- Commodities — Gold, Silver, Crude Oil (WTI & Brent), Natural Gas, Copper, and other key commodities that drive market sentiment.
- Forex — USD/INR, EUR/USD, GBP/USD, USD/JPY, and other major currency pairs with real-time bid/ask spreads.
- Crypto — Bitcoin, Ethereum, and top cryptocurrencies with live price feeds.
The market ticker bar at the top of the terminal scrolls key prices continuously, giving you a Bloomberg-style at-a-glance view. NSE and MCX market status indicators in the header show whether Indian exchanges are currently open, in pre-market, or closed.
AI Trade Signals
The AI Signals panel uses machine learning models to analyze market conditions and generate actionable trade signals. Each signal includes:
- Direction — Bullish, Bearish, or Neutral outlook with clear visual indicators.
- Confidence Score — A percentage score (0-100%) indicating the model's confidence in the signal. Higher scores suggest stronger conviction.
- Affected Assets — A list of specific stocks, indices, or commodities that the signal applies to, so you know exactly what to watch.
- Rationale — A brief AI-generated explanation of the factors driving the signal, including technical patterns, news catalysts, and macro conditions.
- Timestamp — When the signal was generated, so you can assess its freshness and relevance.
News Intelligence
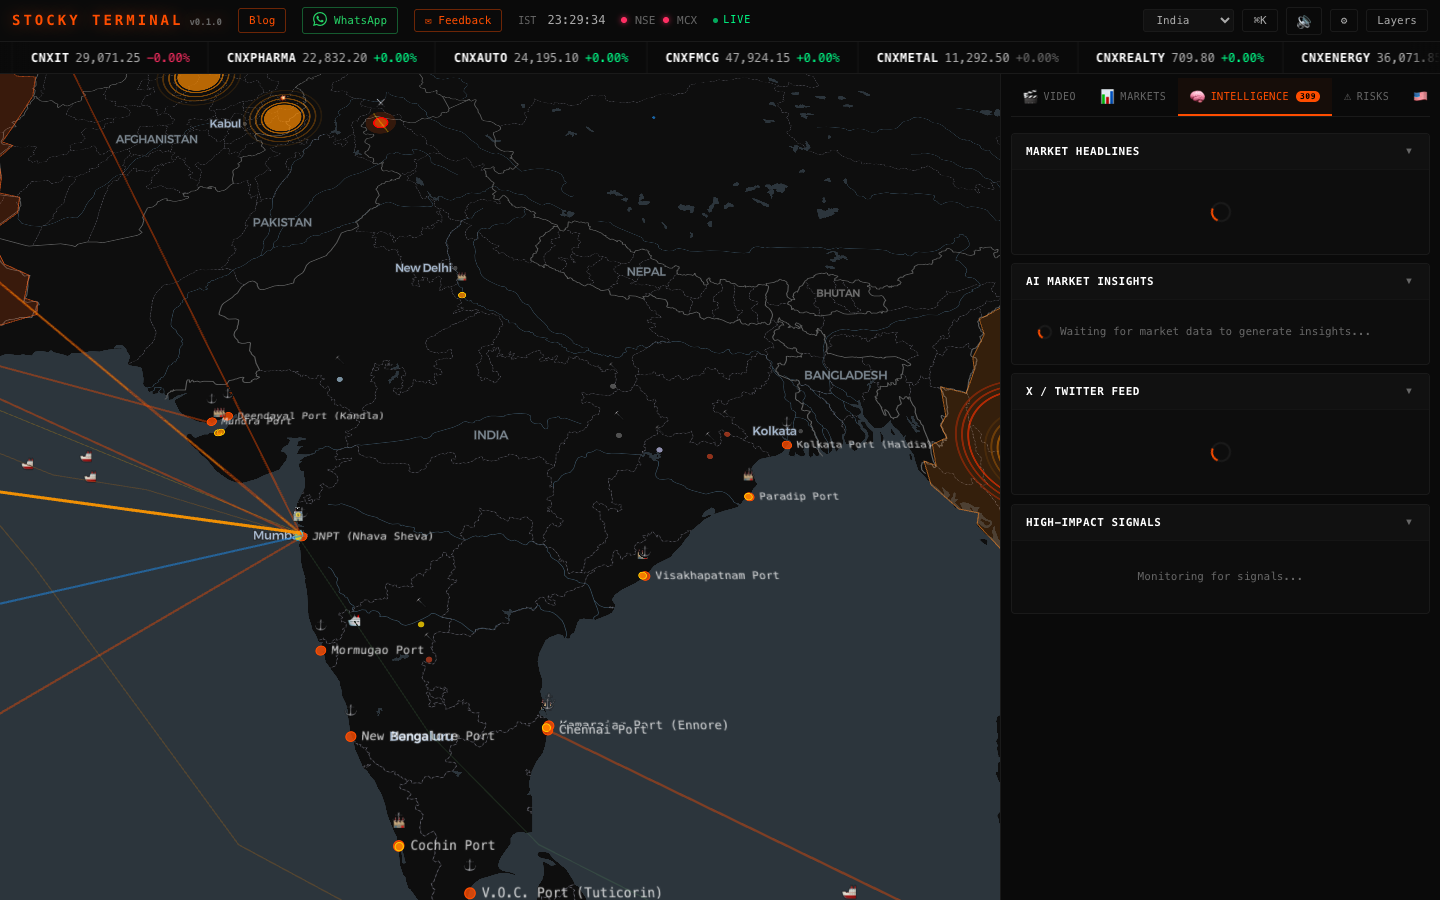
The Intelligence tab aggregates news from 30+ RSS feeds spanning financial news, geopolitical analysis, central bank communications, and commodity market reports. Each article is processed through an AI severity scoring system:
- Critical (Red) — Market-moving events requiring immediate attention: central bank rate decisions, major geopolitical escalations, black swan events.
- High (Orange) — Significant developments that could affect specific sectors or asset classes within hours.
- Medium (Yellow) — Notable news that provides useful context for market analysis but may not require immediate action.
- Low (Gray) — Background information, scheduled data releases, and routine market commentary.
The High Impact Signals sub-panel filters for only the most critical developments, giving you a noise-free feed when markets are volatile. The X/Twitter feed panel curates posts from verified financial analysts and market commentators.
Interactive Map
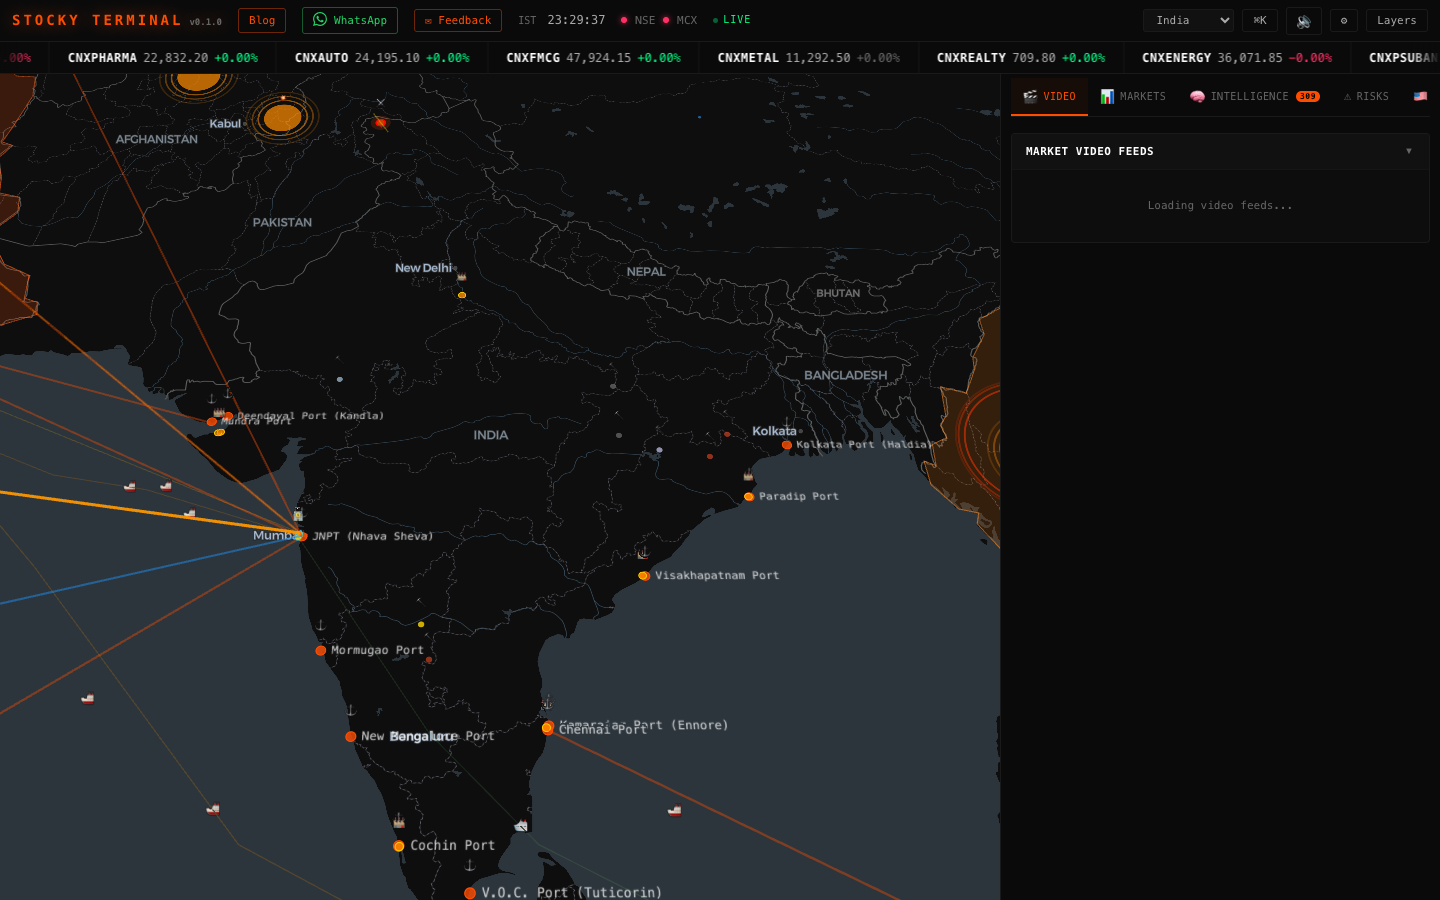
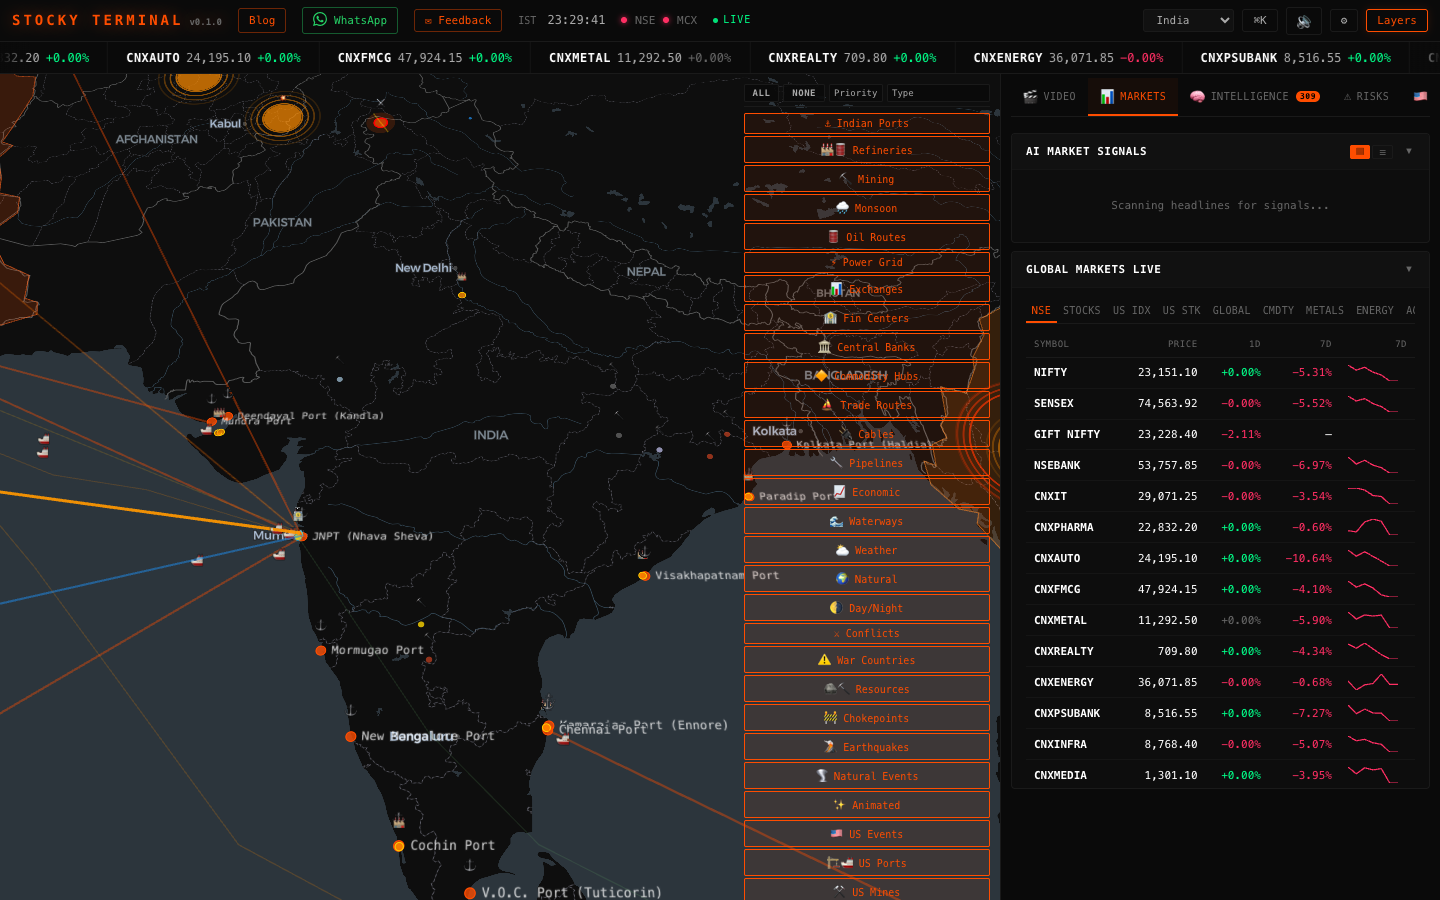
The 3D globe visualization is built on deck.gl and MapLibre GL, rendering 27+ real-time data layers. Each layer is independently toggleable and categorized for easy discovery:
- Infrastructure — Indian ports, refineries, mining clusters, power grid nodes, submarine internet cables, oil & gas pipelines, and US manufacturing facilities.
- Trade & Shipping — Global trade routes with animated vessel paths, maritime chokepoints (Suez, Malacca, Hormuz), and US trade corridors.
- Finance — Stock exchange locations, financial centers, central bank headquarters, and commodity trading hubs plotted on the globe.
- Geopolitical — Active conflict zones, war-affected countries, and a geopolitical risk heat map.
- Natural & Weather — Real-time earthquake data from USGS, GDACS disaster alerts, Indian monsoon coverage, day/night terminator, US wildfire tracking, weather overlays, and internet outage monitoring.
- Transport — Live flight tracking and vessel AIS positions for monitoring global logistics.
The layer control panel supports filtering by priority level (Critical to Low) and by category. Use the region selector in the header to fly to India, Asia, MENA, Europe, Americas, or a full global view.
Daily Market Briefs
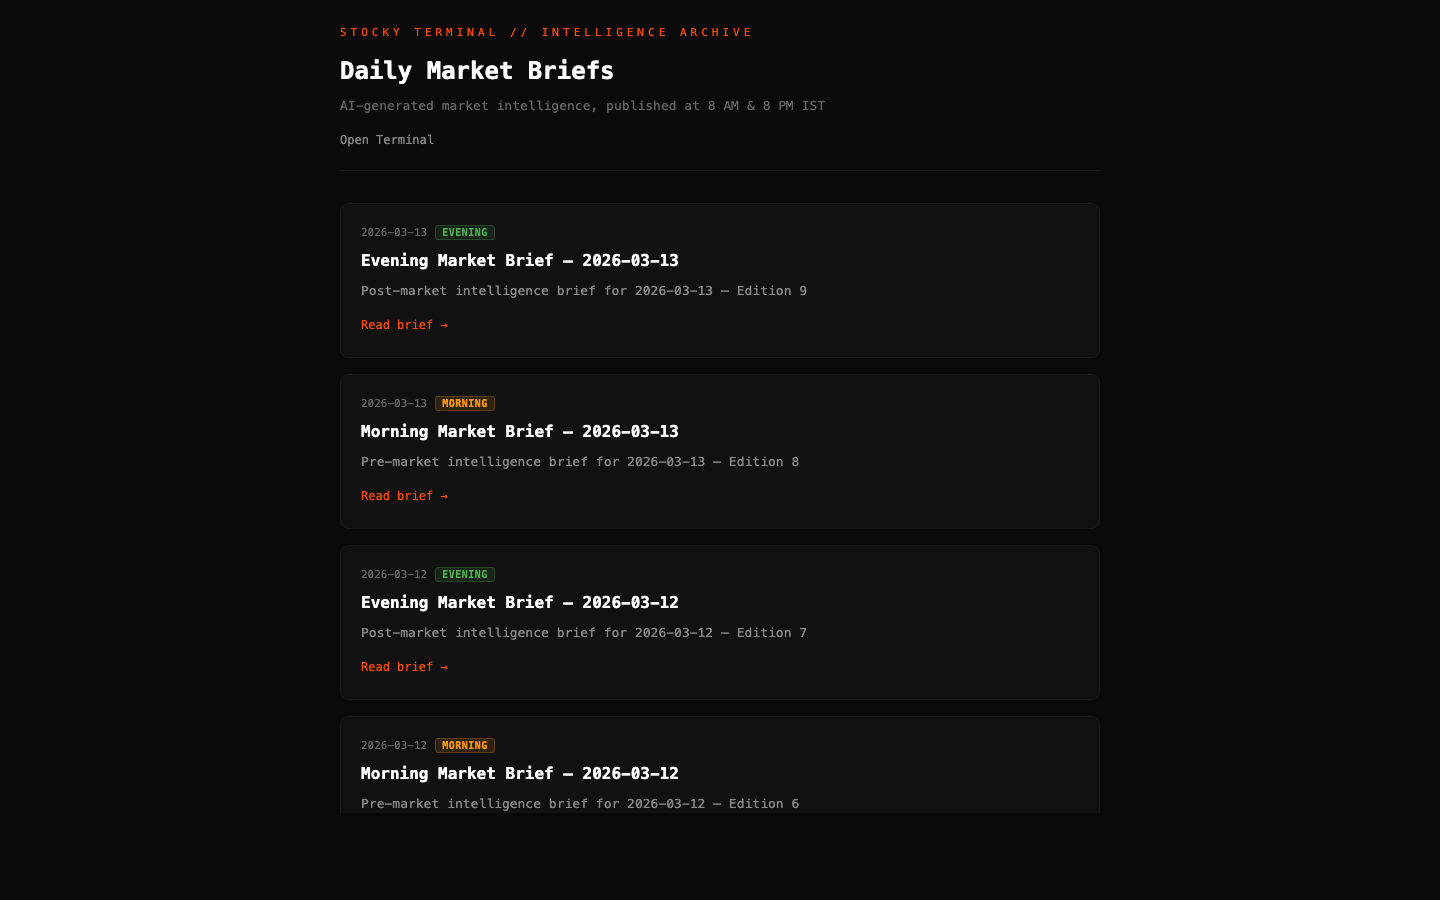
Every weekday at 8 AM and 8 PM IST, Stocky Terminal automatically generates comprehensive market intelligence briefs using AI. These briefs are published to the blog and cover:
- Market Summary — Key index movements, sector rotation, and notable price action from the session.
- Global Macro — Central bank developments, economic data releases, currency movements, and bond yield changes.
- Commodities & Energy — Oil, gold, metals, and agricultural commodity trends with supply/demand context.
- Geopolitical Watch — Conflicts, sanctions, trade policy changes, and diplomatic developments affecting markets.
- Crypto Digest — Bitcoin, Ethereum, and altcoin movements with on-chain and regulatory context.
Morning briefs preview the upcoming session, while evening briefs recap the day's action. Each brief can be downloaded as a PDF for offline reading. Subscribe via email to receive briefs directly in your inbox.
Video Feed
The Video tab in the sidebar streams market analysis content from curated YouTube channels. Channels are selected for their quality of technical analysis, macro commentary, and market education. The feed automatically refreshes to show the latest uploads, so you always have access to timely video analysis alongside your data panels.
Videos play inline within the terminal — no need to switch tabs or leave your workspace. This keeps your market data and news feeds visible while watching analysis.
Risk Monitor
The Risks tab provides specialized panels for monitoring threats to portfolios and supply chains:
- Commodity Risk Gauge — A real-time risk score for key commodities based on supply disruptions, geopolitical tensions, weather events, and inventory levels. The gauge uses a color-coded scale from green (low risk) to red (critical risk).
- Monsoon Impact — Tracks the Indian monsoon's progress and its impact on agricultural commodities, rural consumption, and related equities. Includes rainfall deviation data, reservoir levels, and crop sowing progress.
- Supply Chain Monitor — Tracks disruptions across global shipping lanes, port congestion, and logistics bottlenecks that could affect trade-dependent sectors.
- Wars & Conflicts — Real-time monitoring of active conflicts worldwide with analysis of potential market impact, affected trade routes, and commodity price implications.
- Event History — A timeline of past high-impact events and their market effects, providing historical context for current developments.